Using JIRA with SpecShip: a step-by-step walkthrough
Read 9 min
Most of a long session’s token bill is cache reads, not fresh input — until your system prompt drifts and the hit rate falls off a cliff. Here’s how to see it.
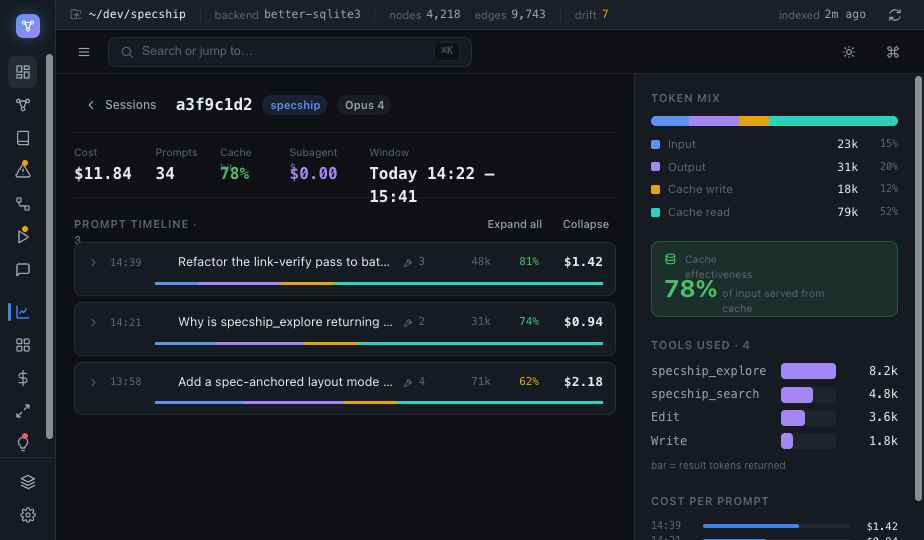
If you only look at one number on a long agent session — total tokens — you'll badly misread the economics. The headline figure is enormous, but most of it isn't what it looks like. The interesting story is in the split, and the split is usually invisible.
Modern agent sessions lean hard on prompt caching: the big, stable prefix of a conversation — system prompt, tool definitions, the files already pulled in — gets cached and re-read at a fraction of the price of fresh input. In a healthy long session, the majority of token volume is cheap cache reads, not expensive fresh input. That's why raw token counts and actual dollars diverge so sharply: a session can show a frightening token total and a modest cost, because almost all of it was cache hits.
Caching is fragile in one specific way: it's a prefix match. Change something early in the conversation — a system prompt that varies run to run, tool definitions that reorder, a file re-read in a slightly different form — and everything after the change point misses. The hit rate doesn't degrade gracefully; it falls off a cliff. A session that was 90% cache reads in the morning can be 90% misses in the evening for no reason you'd notice from the transcript, and the cost climbs to match.
Your cache hit rate is a property of how stable your prompt is, not how big it is. Stability is the thing to instrument.
SpecShip ingests Claude Code's own session logs in the background — every prompt, every tool call, every token count and cost it already records to disk — and turns them into analytics you can actually act on: a per-day cost line, a by-model breakdown, the cache hit rate, and the prompts that cost the most. No new instrumentation; it's reading the audit trail Claude Code already writes.
The same machinery answers a sharper question on the SpecShip Impact page: what did the graph tools spend versus what they saved. Spend is measured exactly — the tokens SpecShip's own tool calls put into the conversation. Saved is a deliberately conservative estimate — for each structural query, the cost of the files those symbols live in, which a plain Read would have pulled, minus what the query actually returned. A query whose symbols can't be resolved contributes zero saved, so the number under-claims rather than over-claims. Net is shown honestly, even when it's negative.
The takeaway isn't "tokens are cheap" or "tokens are expensive." It's that the bill has structure — cache versus fresh, spend versus saved — and once you can see the structure, the expensive long sessions stop being a mystery and start being something you can tune.